

MORGANTOWN, W.Va. — Across the Appalachians, forests that can appear timeless are constantly changing, exchanging carbon, water and energy with the atmosphere as trees and other vegetation respond to sunlight, rain, drought and changing weather.

Scientists can measure that activity as often as 20 times every second. Understanding what all those measurements mean, however, can take months or even years.

Researchers at West Virginia University are now experimenting with artificial intelligence to dramatically shorten that wait, potentially allowing scientists to observe how forests and other ecosystems respond to drought, wildfire and other environmental events while those events are still unfolding.
“We have amazing tools to measure how these ecosystems breathe, but because measurements are taken 20 times per second, processing this huge, tremendous amount of data into something that’s quality controlled takes immense effort,” said Steve Kannenberg, an assistant professor of biology in the WVU Eberly College of Arts and Sciences.
“In these networks of flux towers, there can be a latency of months to years before data is ready to share with the community,” he said. “It’s that issue this grant is trying to tackle.”
How scientists measure a forest ‘breathing’
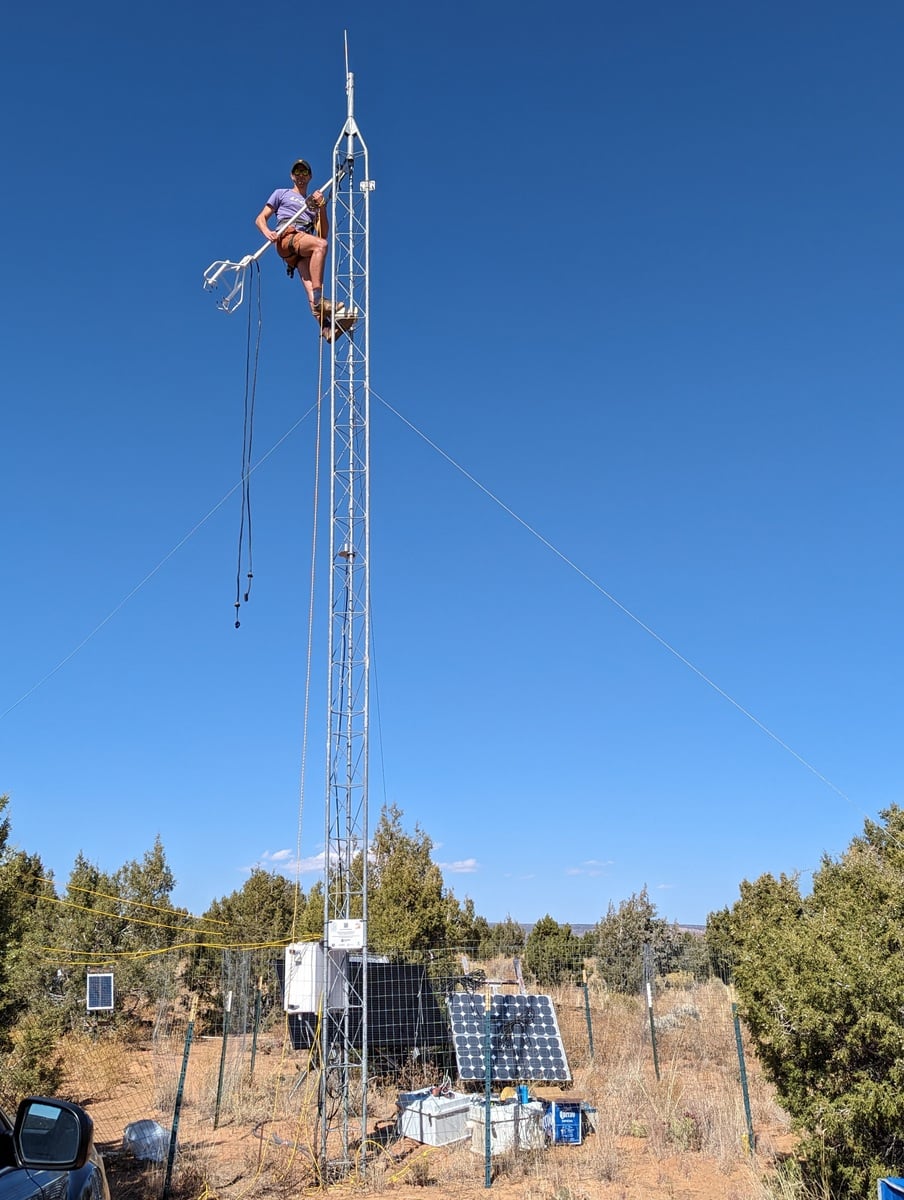
Forests continually exchange gases, water and energy with the atmosphere. Those exchanges can help scientists answer questions such as how much carbon an ecosystem stores, how much water it uses, and how vegetation responds to environmental stress.
Researchers measure those exchanges using structures known as eddy covariance towers, or flux towers—specialized monitoring stations equipped with high-speed sensors.
The volume and complexity of the resulting information create a problem, Kannenberg said.

Researchers traditionally run the measurements through specialized software and then perform extensive quality-control work. They must identify problems caused by rain, wind, or malfunctioning sensors, account for missing observations, and adjust calculations for individual monitoring sites.
“The traditional way to process this data relies on very established mathematical and physics-based equations that take a long time to calculate,” Kannenberg said. “We’re using AI tools to circumvent those complex equations and process the data much more quickly.”
The research is supported by an Early-Concept Grant for Exploratory Research from the National Science Foundation.
WVU postdoctoral researcher Jie Hu, a co-principal investigator on the project, is leading development of what researchers describe as a processing pipeline that can rapidly convert environmental observations into usable information.
“The main goal is to make these products easy to access by cutting the long delays in data release and providing interactive and visual diagnostics,” Hu said.
What happens when a drought arrives?
For Kannenberg, the consequences of that delay became particularly apparent after he moved to Morgantown in 2023.
“When I first moved to Morgantown in 2023, there was a severe drought,” he said. “Cheat Lake was visibly drying up, leaving boats sitting in mud.”
A drought may be apparent to someone watching a lake recede or vegetation dry, but documenting precisely how an ecosystem is responding presents another problem.
“It’s difficult for scientists to study the impacts of sudden events like that because we must scramble to assemble teams and equipment after the fact,” Kannenberg said.
By the time conventional datasets are processed, an unusual environmental event can be long over.
“If there was a severe drought, we wouldn’t know how that’s impacting the ecosystem until a year down the line,” he said. “If there was a wildfire, we wouldn’t know how much carbon was being burned off that ecosystem until years down the line.”
The WVU researchers hope to change that by combining artificial intelligence with another technology known as edge computing.
Rather than continually sending enormous quantities of raw information elsewhere for processing, small computers located where the measurements are collected can begin analyzing the information on site.
The researchers are pairing that approach with data from the National Ecological Observatory Network, or NEON, a federally funded network of standardized ecological monitoring sites across the United States.

The result could move ecosystem monitoring much closer to real time.
Catching moments scientists can now miss
Faster processing could reveal brief ecological events that can disappear into longer-term averages.

Researchers describe them as biological “hot spots” and “hot moments.”
They can include a sudden burst of plant activity following rainfall or localized vegetation stress during drought. The instruments can also detect nonbiological events, such as emissions from nearby vehicles, that researchers need to distinguish from natural ecosystem activity.
“Faster release of accessible flux data doesn’t just help scientists understand how ecosystems are responding to change,” Hu said. “It also gives land managers and decision-makers a near-real-time view of environmental conditions.”
The technology could also tell researchers when the instruments themselves are malfunctioning.
“A ton of money and time goes toward this, but they don’t know if there’s a problem with their instrumentation until someone physically collects the data and processes it,” Kannenberg said of existing monitoring networks.
Near-real-time processing could identify such problems much sooner.
From billions of measurements to a simple question
Kannenberg and Hu are also working on a way for people without specialized training to explore the resulting information.

Their project includes an interactive artificial intelligence interface that lets users ask questions in ordinary language rather than requiring them to understand the underlying datasets and processing systems.
One example provided by Kannenberg is particularly relevant to the heavily forested Appalachian state where the research is based:
“Was there a drought last year in West Virginia? How did that impact the forests?”
According to WVU, the goal is for the system to use environmental data to provide scientifically grounded answers.
Kannenberg also plans to incorporate the interface into his Ecosystem Ecology course at WVU.
Testing the technology in two very different landscapes
Although WVU is leading the research, initial testing will take place outside West Virginia.
Researchers plan to test the approach at the Central Plains Experimental Range in Colorado, where grasslands can experience unpredictable bursts of biological activity, and at Harvard Forest in Massachusetts, where a temperate forest follows a more regular seasonal cycle.
The contrasting landscapes will allow researchers to evaluate how the system performs under different ecological conditions.
“I’m excited to streamline the process and see how new technologies in artificial intelligence and edge computing can accelerate discoveries we haven’t even imagined yet,” Hu said.
Kannenberg said the project’s significance may ultimately lie not in one particular discovery, but in allowing scientists to recognize unusual environmental events soon enough to study them.
“By having an automatic system that rapidly alerts us to ongoing environmental extremes, we can more easily have targeted field campaigns or measurement campaigns to better understand these events,” he said.
Kannenberg’s broader research examines how forests and drylands store carbon and respond to environmental change. His recent work has included research into the western United States’ 23-year megadrought.
For scientists studying forests and other ecosystems, the new project aims to shorten the gap between an event in the natural world and researchers’ ability to understand it—from months or years after an event to when the forest is still responding.